rtrace
A wrapper for recon library. This application also exposes a REST api for call tracing. Although recon supports various trace patterns, this api allows on tracing function calls with just module and function name for a maximum of 100 calls.
Usage
Add rtrace as a dependency in rebar.config
{deps, [
	{rtrace, "<latest release>"}
	]}.
By default, the application listens on port 15000 for incoming api requests. This port can be customized by setting http_port value in sys.config. The application can also be restricted to listen only on a specific ip address by setting http_host_ip property.
[
	{rtrace, [
		{http_port, 17000}, %% a different port
		{http_host_ip, {127, 0, 0, 1}} %% listen only on localhost
		]}
].
API
The application exposes the following api's.
| POST /api/v1/trace | |
| Description | Start trace |
| Request |
{
  "mod": "maps",
  "fun": "get",
  "calls": 10
}
|
| Response | "cfa0b15d-0ecb-4486-8768-8bf1755a5c92" |
| GET /api/v1/logs/:uuid | |
| Description | Get logs for specified trace request |
| Response | [ "...", "..." ]The response is a list of trace logs |
NOTE: All requests and responses are encoded as JSON.
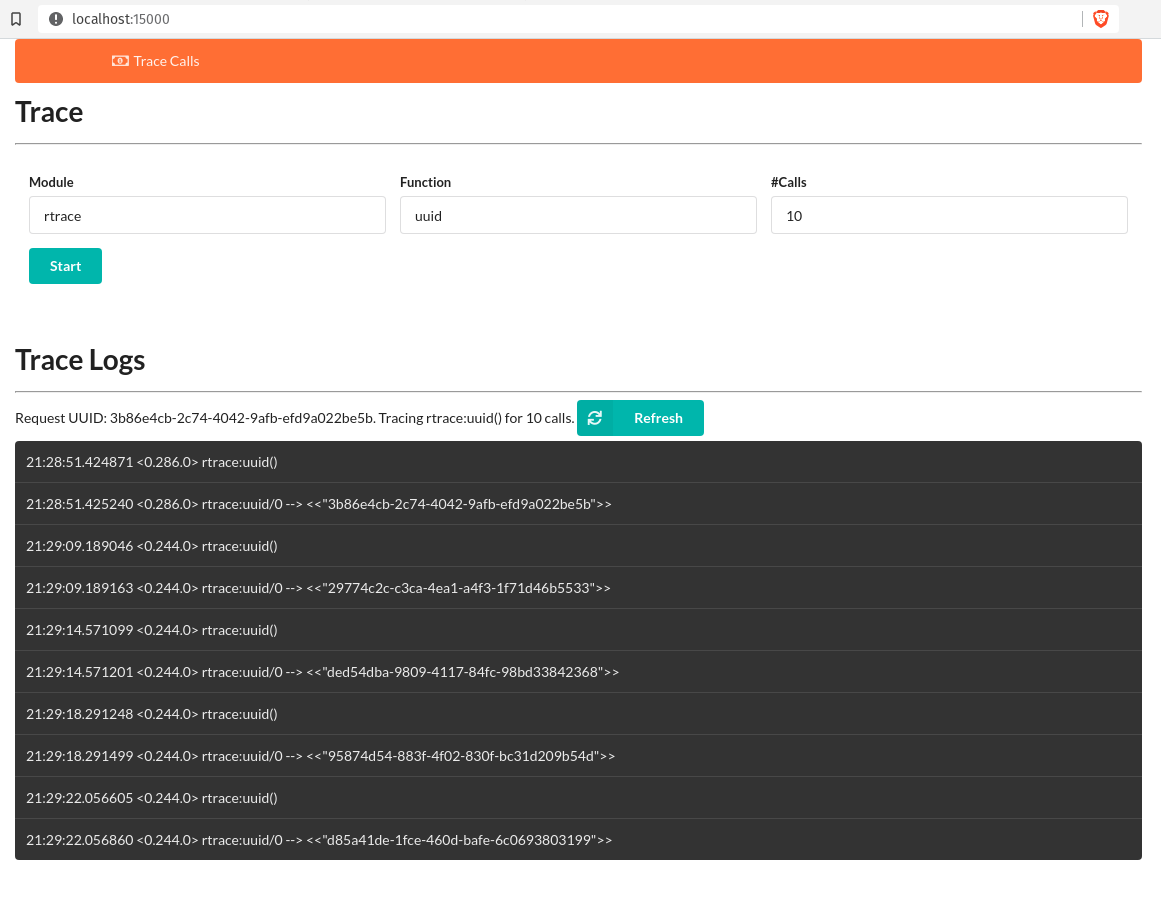
UX
Navigate to http://localhost:15000 in your browser. You can now start tracing and view trace logs from the UI.
- Press
Startto start trace after entering module and function names. - The page will refresh and display a
Refreshbutton along with some information. - Press
Refreshbutton to display the trace logs. The logs would not refresh ifrecontrace limit has been tripped or the function under trace is never called.