


bloccs_web is a real-time, observe-only view of your running bloccs networks that you host directly within your application.
Mount it into your Phoenix app with one router macro and watch messages move
through the topology, drill into per-node metrics, and follow a single message's
whole journey across the network. It reads the library's Bloccs.Introspect API
and the [:bloccs, …] telemetry stream; it never drives the runtime.
Experimental. bloccs_web tracks the bloccs library closely and its API may change between minor versions while both are pre-1.0.
Features
- Embedded Phoenix LiveView dashboard, mounted with a single router macro — no separate server, no JavaScript build in your app (assets ship precompiled).
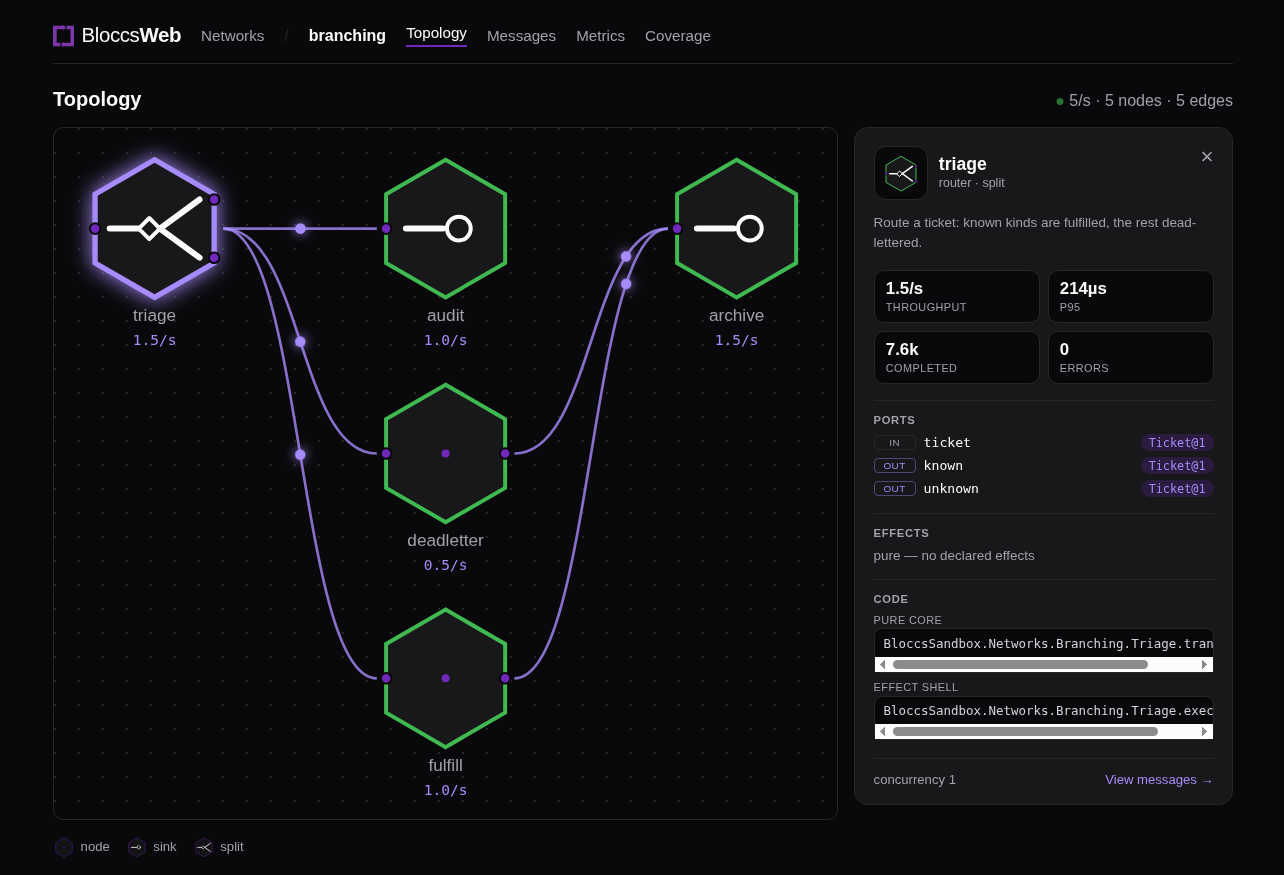
- Live topology drawn in the bloccs hexagon notation, with packets animating along active edges and node state lighting up as messages flow.
- A node inspector for each primitive: kind, ports with their schemas, declared
effects, live metrics, and the code that runs it (
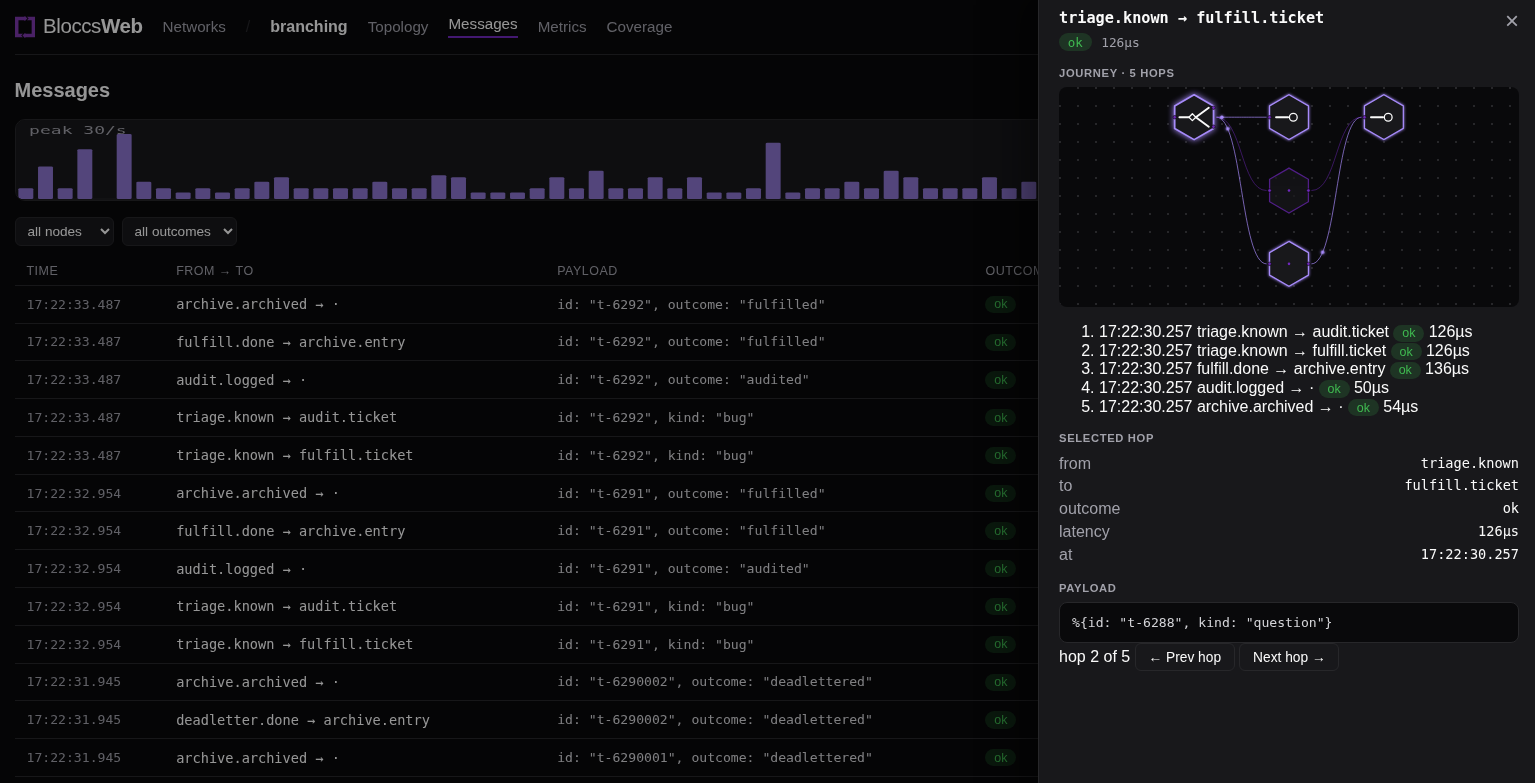
pure_core/effect_shellrefs plus retry / idempotency / batch / join / rate / delay policy). - Per-message journey view: select a message and follow it hop by hop across the network, including fan-in through joins and rollups, with the full path highlighted on the graph.
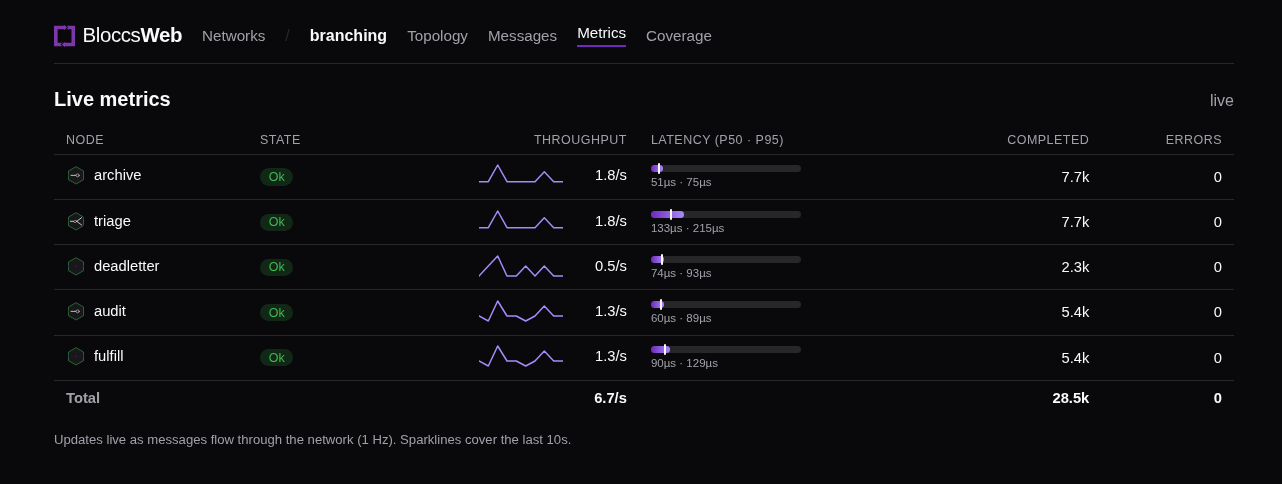
- Per-node metrics on a rolling window: throughput, p50/p95 latency, completed count, error rate, and queue back-pressure.
- A per-second throughput chart and a live message feed with payload snapshots
(when
Bloccs.Inspectcapture is enabled) and a pause control. - Structural coverage: which ports and edges a run actually exercised, plus a
.bloccs-traceviewer. - Access control seam (
Bloccs.Web.Resolver) for per-feature authorization; the dashboard inherits auth from the router pipeline you mount it through.
The panels
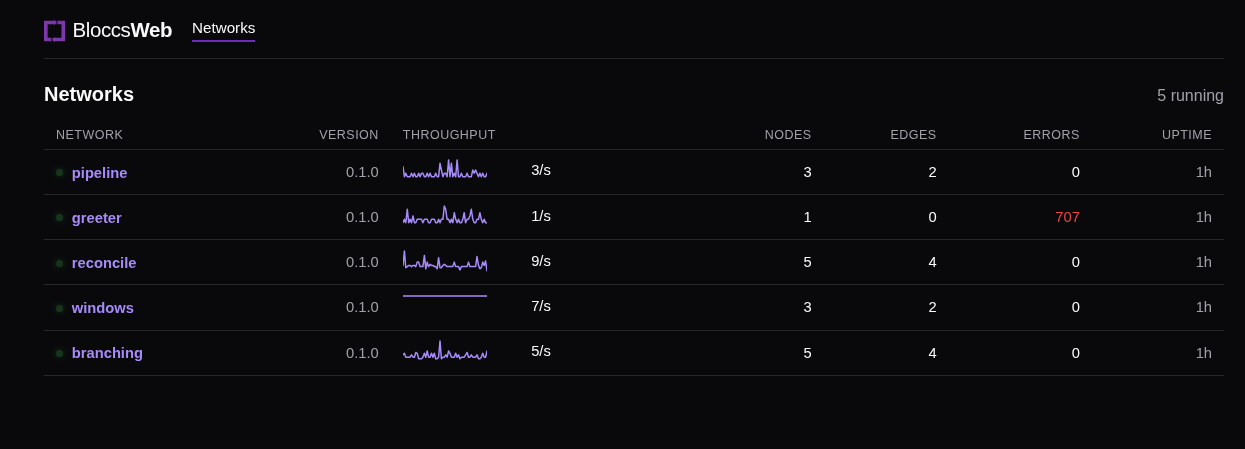
Networks — every running network, with version, throughput, node and edge counts, error totals, and uptime.
Topology — the network graph in the hexagon notation, with a per-node inspector (see the screenshot above).
Messages — a live feed and throughput chart. Selecting a message opens its journey: every hop it took through the network, the full path on a mini-graph, and per-hop detail and payload.
Metrics — per-node throughput, latency (p50/p95), completed count, and error rate, updated live.
Coverage — the ports and edges a recorded run exercised, with a
.bloccs-trace viewer.
Installation
Add bloccs_web alongside bloccs:
def deps do
  [
    {:bloccs, "~> 0.5"},
    {:bloccs_web, "~> 0.2"}
  ]
end
Mount the dashboard in your router and pipe it through your own authentication:
# lib/my_app_web/router.ex
defmodule MyAppWeb.Router do
  use MyAppWeb, :router
  import Bloccs.Web.Router

  scope "/" do
    pipe_through [:browser, :require_admin]   # your existing auth
    bloccs_dashboard "/bloccs"
  end
end
Visit /bloccs. The dashboard ships its own precompiled assets, so the host app
needs no Plug.Static configuration or JavaScript build. See the
installation guide for the Bloccs.Web.Resolver
(per-feature authorization) and asset details.
Try it locally
From a checkout of this repo:
$ mix deps.get
$ mix dev
# open http://localhost:4000/bloccs
mix dev boots a standalone Phoenix endpoint with the dashboard mounted, starts
a sample network, and drives a trickle of traffic so the live metrics and
topology animate. The precompiled app.js bundle is committed, so no Node build
is needed; rebuild it with mix assets.build if you change assets/.
License and Pro
bloccs_web is Apache-2.0-licensed and free. Some advanced features may later be
offered under a bloccs Pro license; the dashboard ships the gating seam (a
Bloccs.Web.Resolver) but no license logic — in the open build every feature is
on.
Community
- Issues and discussion: github.com/Bloccs/bloccs_web
- The library it observes: github.com/Bloccs/bloccs